Estimator和Estimate
Sample statistics 也就是“公式”是有不同计算结果的,也属于random variables;这些公式也被称为estimator,是有sampling distribution的。使用estimator根据某个sample计算出来的值叫做 (point) estimate。
在多个可用的estimator中选择一个的标准是:
- unbiasedness,mean of its sampling distribution 等于 parameter
- efficiency,也就是方差最小。Unbiased estimator会有很多,从中选择最好的那个,就是要选方差最小的那个。
- 这两个对于任何size的sample都是不变的
- consistency,随着sample size增加,estimate接近population parameter的可能性也增加。
Confidence Interval
由于sampling error,point estimate很难真的等于population parameter,所以就会用 confidence interval 来帮忙。
Confidence interval 就是有 $1-\alpha$ 3 的可能性parameter落在这个range里面。Range的两头叫做lower and upper confidence limits.
用practical interpretation来理解(95%) confidence interval:我们有95%的把握,一个95% confidence interval包含了population parameter。
Confidence interval的组成:
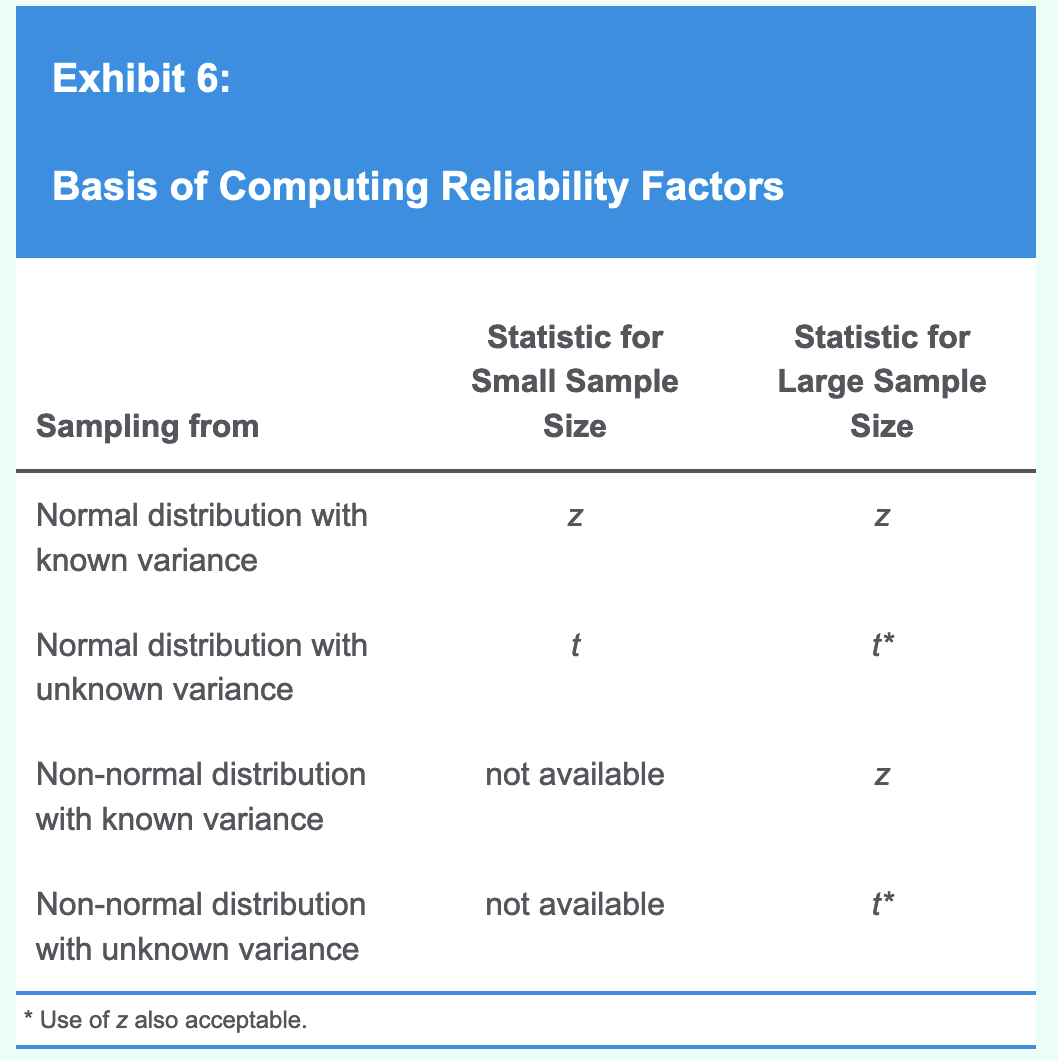
Reliability factor是根据point estimate的分布和degree of confidence来决定的。下面以confidence intervals for the population mean来进行举例:
Normally Distributed Population with Known Variance
对于标准正态随机变量,$z_{\alpha}$ 的值表示有 α% 的值大于这个值。
- 对于已知variance的,举例: $\sigma^2 = 400$;样本量假设为100。
- Point Estimate:从样本得到 sample mean $\bar X = 25$
- Reliability Factor:95% confidence interval 说明 $\alpha = 0.05$,双侧5%那么单侧就是2.5%,$z_{0.025} \approx 1.96$
- Standard Error: $\sigma_{\bar X}=\sqrt{\frac{400}{100}}=2$
- 结果就是 $25 ± 1.95 \times 2$。
所以公式就是: $\bar X ± z_{\alpha /2}\times \frac{\sigma}{\sqrt{n}}$ 根据reliability factor的计算可以看到,degree of confidence越高,reliability factor就会越大(因为α越小 $z_{\alpha}$ 就越大),提供的信息就越少。另外,variance越小、样本量越大,估计就越准确。
计算所需样本数通常来说就是把公式反向用:

对于不知道variance的,如果是大样本(超过30),用z-alternative可以算 4
t-distribution可以在以下两种情况中使用:
- 大样本
- 小样本,但是population是正态分布(或近似正态)
计算t值需要使用自由度,自由度是n-1。5

Sample Size
根据confidence interval的结构,将 $ \text{Reliability factor} × \text{Standard error} $ 设为E,那么宽度就是2E。给定degree of confidence和E,就能够计算需要的样本量:
但是样本量不是越大越好,有以下考量:
- the need for precision
- the risk of sampling from more than one population,样本太大的时候可能就会跨population
- the expenses
Biases
Data snooping bais
Data snooping is the practice of determining a model by extensive searching through a dataset for statistically significant patterns. 就是不断“炼丹”来找到“模型有效”的证据。
通过将data分成training、validation、test三个dataset,就可以通过test dataset所提供的out-of-sample test来检测是否有data snooping问题。
另外,如果一个投资策略被其他投资者获知了,那么price可能就会作出反应,使得这个策略在未来没有用。
Data mining是一种snooping表现形式,McQueen and Thorley表示有两个特征值得注意:
- Too much digging/too little confidence。即使作者没有说明测试了多少个variables,也应该留意文中的线索。特别是对于dataset里的pattern,在描述时使用“we noticed (or noted) that” or “someone noticed (or noted) that,”之类的用语,可能就是digging的信号。
- No story/no future。对于所提出的pattern,应该有相应的经济学解释,否则predict能力不一定行。但是这是必要不充分条件,比如前面提到的策略publish之后可能就会失效。
Sample Selection Bias
由于systematically excluding some members of the population according to a particular attribute而导致的bias。比如一个database只track现在还存活的company,那么就会把曾经存在但是现在消失了的公司排除在外,导致这个bias出现(这种情况有单独的名字,幸存者偏差)。
再举例,比如分析国际市场数据的时候,表面上看分析现在还在运作的index是很合理的行为,但是实际上忽略了有的市场可能因为通胀、国有化等等原因已经fail了,不再存在了,从而导致高估了投资回报。
还有implicit selection bias,比如申请列入NYSE的门槛很高,导致如果选择NYSE作为研究对象,那么就已经隐含了选择的标准,从而带来bias。
还有backfill bias,比如当一只hedge fund新加入index的时候,它的过往performance也可能会添加到database里;通常来说只有表现好的才会加入index,所以这些添加进来的过往performance会导致index的performance虚高。
Look-Ahead Bias
如果test中使用的information在test date是not available的,那就会产生look-ahead bias。可以使用point-in-time(PIT)数据来避免一些情况下的这个问题。
以及,对于validation和test dataset,需要用training dataset的标准差来进行normalize,否则就会产生look-ahead bias。
Time-Period Bias
例如使用短的时间序列可能会给出period-specific的结果,反映不了长期。但是长时间序列可能会受到time frame内发生结构性变化从而导致实际上是两个distribution的问题——例如利率发生了变化,所以前后两段的环境其实是不同的。